You have to set “Anyone with the link” in the access settings for that file or we won’t be able to download it.
Here,
Here, please use this link (“Anywone with the link”):
HI,
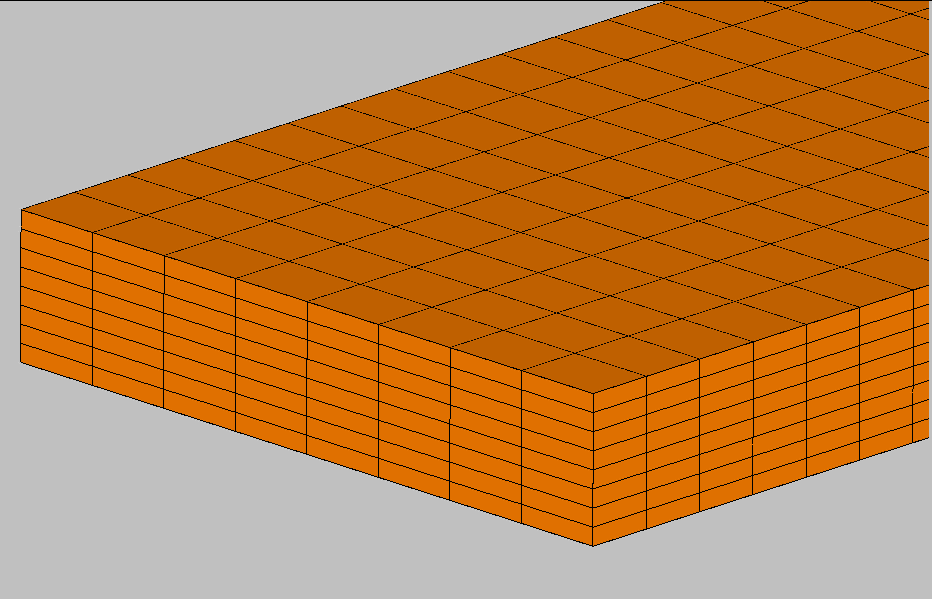
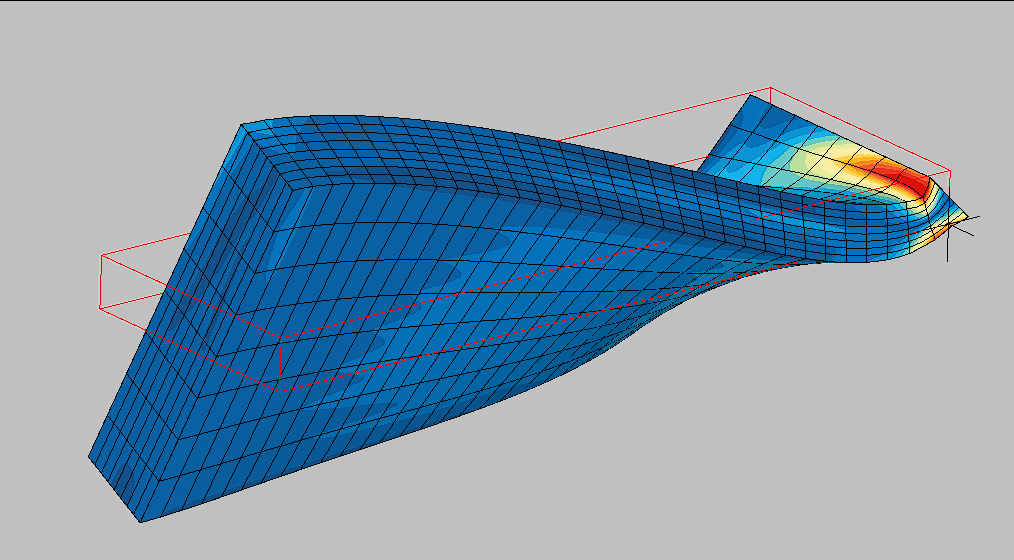
I have torture three bricks of API-579-2021. One under Torsion, one under bending and other under a combo of torsion and bending. All three with the same mesh density and C3D20R.

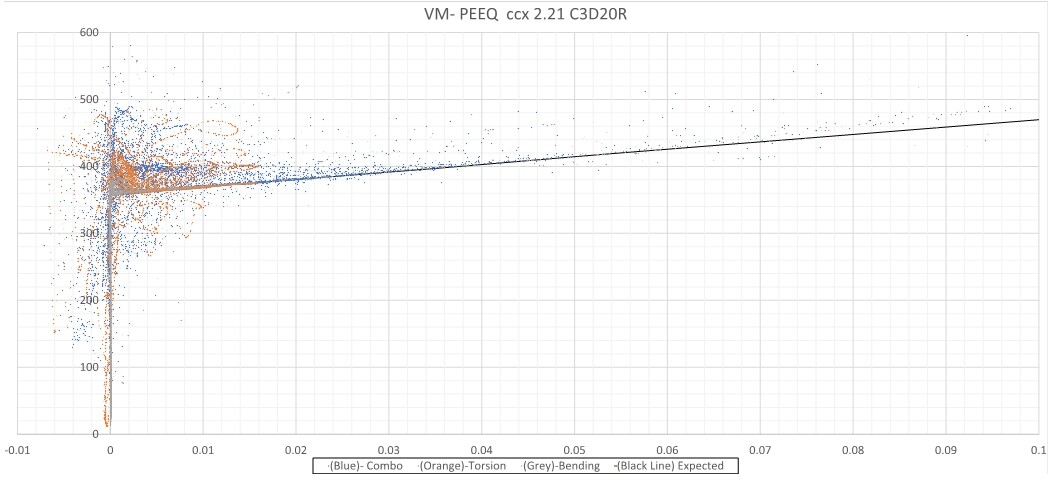
I have later represented all the final VM Stress State versus PEEQ Value for the whole set of nodes.
I would expect some discrepancy with respect to the ideal Axial, Biaxial and Planar Stress States (which has shown to behave as expected) due to interpolation but the results are worse than I expected.
I’m jet not sure how to read it as some of the PEEQ values are negative and I can’t make them to approach to the curve with refinement.
These are the results which in some way seems to confirm Juseche discrepancy when plasticity and Bending/Torsion is present.
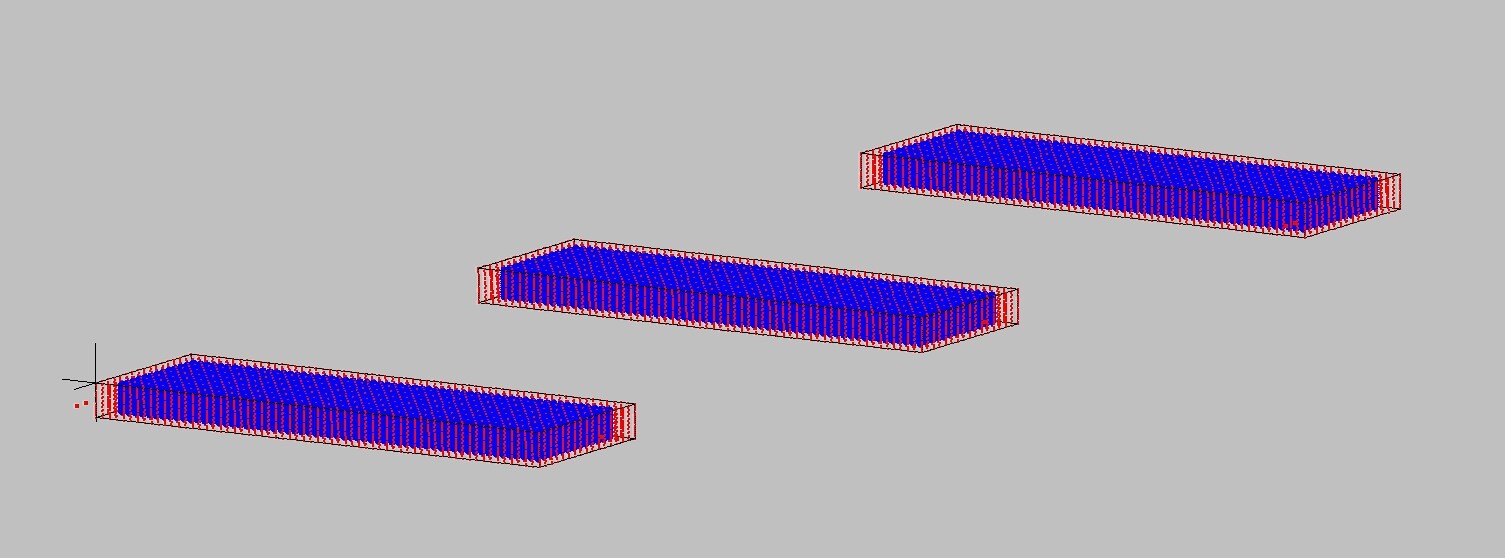
I think the problem comes from elements with boundary conditions.
Try running my model and plot only points at the center of the dent.
Jack
Hi, Juseche,
Nice finding.!!!. It confirms my believe that it is always worth to go all the way and clear up all doubts.
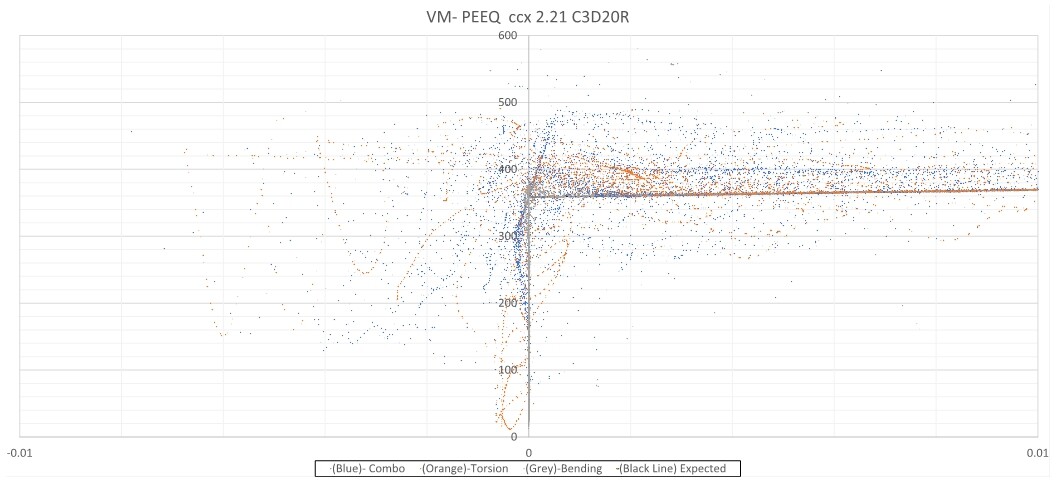
I have selected nodes away from BC and It cleans many of the Stress Strain States below the curve but I still have some questions.
-¿How can PEEQ be negative? It is the most surprising to me.
-¿How can VM end up above the curve?. Error due to extrapolating values from the integration points or ¿ Maybe some stress components do not induce plastic Strain?.
-¿How can VM end up below the curve?. Error due to extrapolating values from the integration points or ¿VM evolution at some point has start to decrease due to the load path?

I don’t know why PEEQ is negative and VM ends up above/below the curve… it’s weird!
However, I found that my results went better with C3D8R for SVM vs PEEQ. Please use this element in your model and check it. I think, results will go better (far from BC).
Jack
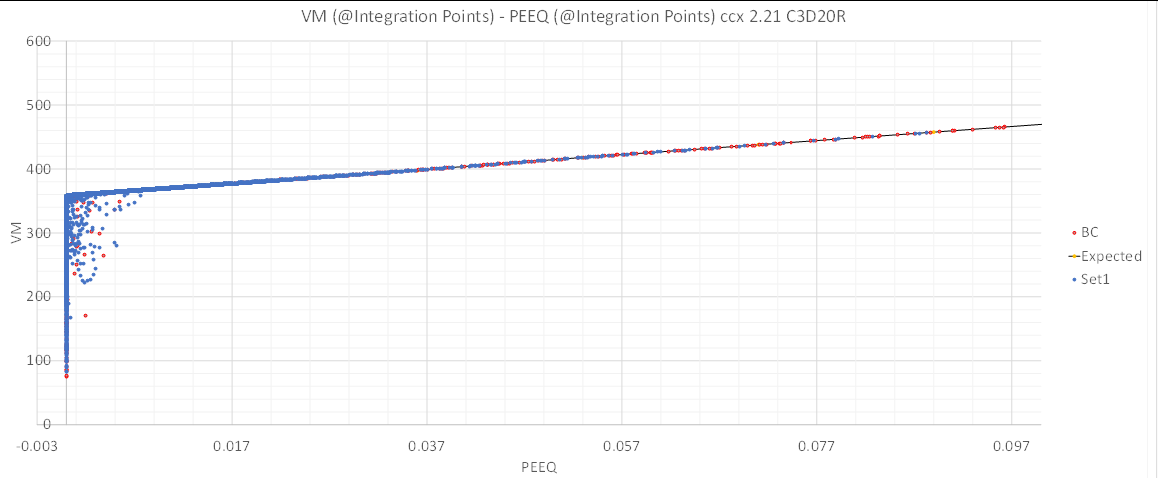
I have extract PEEQ and VM (computed from the stress components) at the integration points to remove any uncertainty from the interpolation process.
Result is much clean. ![]()
I was not aware how much noise the interpolation process was introducing into the results.
I’m postprocesing PEEQ and VM from the integration points in the future.
There is still an small amount of points below the curve which I need to examine carefully (Not only the BC elements). ¿Any idea why some points end up there?
The fact that data points end up on top of the curve doesn’t mean the result is correct.
I would add at leats 3-4 layers through thickness to your model. Only one is not enought.
Very interesting!
I agree with use more elements along thickness. But elements turns bad shaped (small relation thk/long). Could this affects the results?
By the way, how to plotting not- interpolated-to-nodes element results in Calculix graphics?
Thanks!
I think so.
Check this post.
Thank a lot for your help!
Jairo